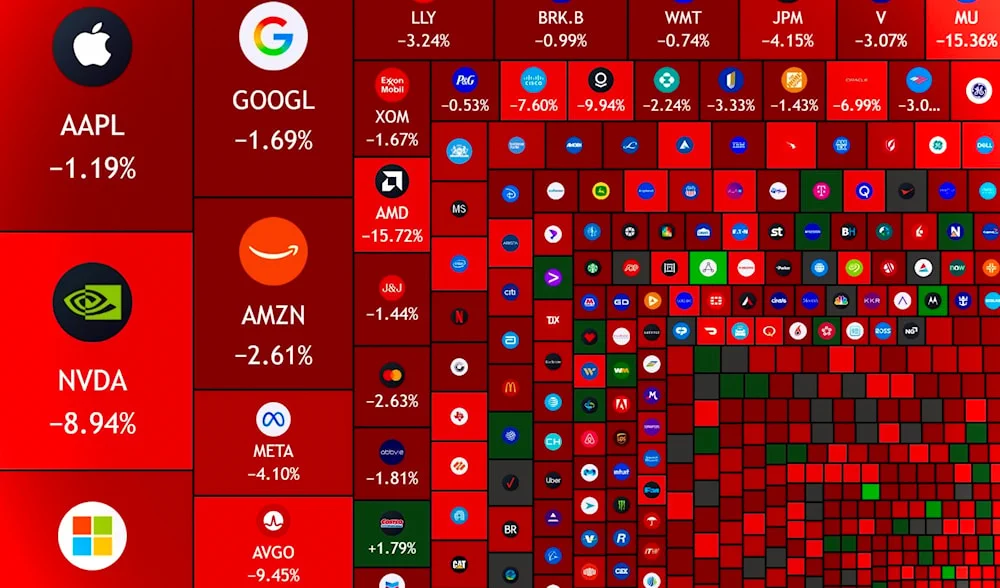
U.S. shares lost a reported $3.2 trillion in value on November 5 as investors marked down the AI infrastructure trade. The number measures stock-market wealth, not cash leaving America—and the reversal after Wednesday’s rally exposes how much expected growth depends on permission to build.
The United States did not lose $3.2 trillion from its bank accounts on Thursday. Investors instead assigned a much lower price to the companies represented in a broad stock-market index. The distinction matters: the sell-off was real, but the headline number describes a change in valuations, not a withdrawal from the economy or the Treasury.
The Financial Times, in reporting republished by The Irish Times, put the November 5 decline at $3.2 trillion on the S&P 1500 Composite. Its account and separate reporting from CNBC and the Globe and Mail identified fears about slower artificial-intelligence infrastructure development after Tuesday’s Democratic election victories as a central driver. That interpretation helps explain the market’s abrupt reversal. It does not establish how much spending will actually disappear.
What the $3.2 trillion stock-market loss measures
A company’s market capitalisation is its share price multiplied by its outstanding shares. If investors accept a lower price for the shares being traded, that price also marks down the value of the much larger stock of shares that did not change hands. A large valuation loss therefore does not require an equally large amount of cash to be sold, withdrawn or transferred abroad.
Consider a simplified company with one billion shares. A fall from $100 to $90 removes $10 billion from its market value, even if only a small fraction of those shares trade that day. The company’s bank balance does not automatically shrink by $10 billion. Shareholders’ holdings are worth less at the new price.
The FT’s chosen universe is broad, but it is not literally every American asset. S&P Dow Jones Indices says the Composite 1500 combines the S&P 500, MidCap 400 and SmallCap 600 and covers approximately 90% of U.S. market capitalisation. It excludes private businesses and does not measure property, bonds or national output.
This also explains why market-loss headlines need an index attached. The Globe and Mail’s closing report, credited to Reuters, the Associated Press and Globe staff, described roughly $3 trillion erased from S&P 500 companies. That is a narrower universe than the FT’s $3.2 trillion S&P 1500 figure. The rounded totals are broadly consistent in scale, but they are not interchangeable measurements. VibeCodAI has not independently reproduced the FT’s market-value calculation.
Calling this “paper wealth” does not make it harmless. Investors who sell realise losses; households with equity holdings have less wealth; and companies may find raising new equity less attractive at lower prices. Those possible consequences are different from claiming that $3.2 trillion of cash left America in a day.
A broad rout, with AI at its centre
The closing index moves establish the severity without relying on the trillion-dollar estimate. The S&P 500 fell 4.36% to 7,353.73, the Nasdaq Composite dropped 5.52% to 24,315.00, and the Dow Jones Industrial Average lost 3.44% to 51,523.06, according to the Globe’s report. CNBC’s after-close account rounded those declines to 4.4%, 5.5% and 3.4%, respectively, with the Dow down about 1,833 points. All three had their worst sessions since the April 2025 tariff shock.
The Nasdaq Composite is not the Nasdaq 100: the FT reported a steeper 6.4% decline for the latter. Keeping those benchmarks separate avoids making two legitimate figures look contradictory.
The selling was concentrated in businesses exposed to AI investment, but spread beyond them. Nvidia fell 9.3%, according to the FT; CNBC put its market-value loss above $440 billion and the combined loss for the Magnificent Seven technology companies above $1 trillion. Those losses are components of the broader rout, not extra sums to add to the $3.2 trillion. CNBC reported that all 11 S&P 500 sectors finished lower.
Why the market changed its mind after Wednesday
The sequence is important. Tuesday’s election result was followed by a rally, not an immediate market-wide rejection. On Wednesday, the S&P 500 recorded its biggest daily percentage gain in three months. The Globe’s report described an initial response in which reduced political uncertainty and the prospect of divided government supported risk appetite.
By Thursday, reporting focused on another implication of the same result: newly elected officials who had campaigned against data-centre expansion could constrain the facilities underpinning the AI spending boom. The FT quoted SYZ Group investment chief Charles-Henry Monchau saying investors feared that peak AI capital spending was behind them.
There is no need to assume that every investor suddenly reached the same conclusion. A market price aggregates changing positions, expectations and appetite for risk. Wednesday’s relief over the overall political picture and Thursday’s anxiety about a particular growth engine could coexist. The latter became powerful enough to overwhelm the former.
Nor was politics the only pressure. The Globe noted financing concerns around AI-focused cloud providers after borrowing costs rose late in the summer, and reported that Qualcomm’s smartphone-chip sales had missed expectations. Attributing every stock’s decline to one election result would flatten different risks into a story the evidence cannot support.
The link between a building delay and a chip valuation
The AI investment chain connects physical construction to financial expectations. A data centre needs land, power connections, permits and equipment before it can turn installed computing capacity into a service customers pay for. If a project slips, chip and server deliveries may move later, a cloud operator’s revenue may arrive later, and financing may remain outstanding while capacity is not yet earning.
That is an economic mechanism, not proof that any particular order has been cancelled. Investors can lower the price they will pay for expected future profits before companies reduce their reported earnings forecasts. They can also demand a larger cushion for uncertainty even if their central profit estimate stays the same.
Friday’s CNBC live coverage supplied a useful counterpoint: Bank of America analyst Wamsi Mohan attributed the recent sell-off in AI-exposed IT hardware to lower valuation multiples rather than lower earnings estimates. That is an analyst’s assessment of part of the market, not an audit of the entire AI economy. It nevertheless cautions against translating a stock-price collapse directly into an equivalent collapse in expected sales.
The same distinction applies to financing. As VibeCodAI’s examination of ING’s reported data-centre loan auction explains, a loan offered for sale is a test of the price buyers will pay, not evidence by itself of a default. Lower equity prices, loan discounts and missed payments are separate signals.
Investor fear is not an enacted nationwide halt
The reporting supports a repricing of political risk. It does not establish a nationwide construction ban or show that the full AI investment pipeline will be stopped. Campaign positions, proposals, state decisions and federal legislation have different routes to implementation. Existing facilities and proposed campuses need not face identical restrictions.
The industry's exposure is therefore project-specific. The relevant questions are which sites still need approvals, what power arrangements they have secured, whether customers have binding commitments, and how delays affect the operator’s cash needs. A single market-wide loss figure cannot answer them.
For the same reason, a more restrictive political environment does not automatically mean demand for AI services has vanished. It may constrain supply, raise costs, delay revenues or reduce the return on a planned investment. Those outcomes can hurt valuations through different channels—and require different evidence.
Friday’s rebound leaves the central question open
There was some buying back on Friday, November 6. In CNBC’s update timestamped 10:00 p.m. Africa/Addis Ababa time, the Nasdaq Composite was up about 1.5%, the S&P 500 about 0.8%, and the Dow around flat. These were intraday figures, not Friday’s closing results, and did not erase Thursday’s losses.
The next useful evidence is not another dramatic dollar total. It is whether permitting decisions, construction schedules, customer contracts and company spending guidance confirm the slowdown investors fear. If those deteriorate, Thursday’s repricing will have a firmer operating basis. If projects and profits hold up, the fall may prove more a reset in the premium investors were willing to pay.
The $3.2 trillion headline captures the scale of one day’s change in expectations. The unresolved issue is how much of the AI growth already embedded in stock prices depends on infrastructure that communities and regulators have yet to let companies build.